
 Google Analytics can be an incredible tool for businesses to understand visitors’ behavior on their site or app and improve their customer interactions to maximize conversions.
However, to get the most out of this tool, you must know the most important KPIs (Key Performance Indicators) to keep track of.
While each’s relevancy varies depending on your business type and funnel, some indicators are essential to almost all businesses. Knowing what you can measure and what you can do with the data you can collect will definitely help you set your Google Analytics account for success.
In this article, we’ll go over the six most important metrics you can get from GA4 and some examples of how what you can do with them.
Top metrics you can get from GA4
#1: Users
The number of users (or visitors) on your site is the first thing that comes to mind when thinking of site metrics.
And when it comes to GA4, the primary user metric you’ll find is Active Users, which displays the number of distinct people who have an engaged session or have visited your site or app for the first time.
Unlike Universal Analytics, GA4 places an ID in each user and tracks them across devices, web browsers, and platforms, enabling you to get much more accurate user metrics than in GA4’s older counterpart.
#2: Engagement Rate
The Engagement Rate is a new metric implemented by GA4.
You can think of it as the opposite of the Bounce Rate.
While the former measures the percentage of engaged sessions, the latter measures the portion that wasn’t.
According to Google, an engaged session is one that:
- Lasted more than ten seconds AND
- Generated at least one conversion event OR
- Resulted in at least two page/screen views
By learning the engagement and bounce rates, you can determine whether your site’s pages are captivating enough.
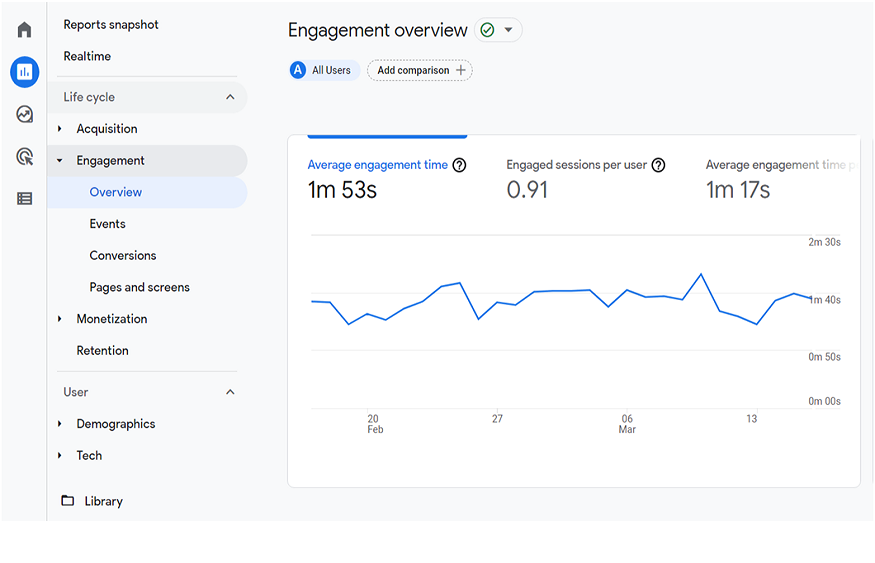
#3: Average Engagement Time
The engagement time is the amount of time a user spends looking at your site or app before closing them or doing something else on their devices.
Learning the average engagement time could have many uses.
For instance, let’s say you’re trying to optimise a page that doesn’t have a CTA, like subscribing or purchasing.
You could create variations and run A/B tests. But how would you measure which is more effective?
Learning the average time visitors spend on each would give you some solid clews.
#4: Sessions
Unlike the number of users, sessions refer to the number of times people have engaged with your site or app, regardless of how many distinct people were doing it.
By default, a session ends after 30 minutes of user inactivity, but you can change that in the settings. If someone starts interacting again after that, that counts as a new session.
These metrics can provide you with many insights.
For instance, by finding the average number of sessions per buyer, you can better understand your buyer’s journey and adjust your funnel accordingly.
And by getting specific data like the interval between sessions, you can predict which leads are most likely to convert and focus your remarketing campaigns on them.
#5: Event count
Events are any action a user takes on your site.
That includes clicks, pageviews, form submissions, downloads, scrolls down the page, or any other action your GA account is set to track.
Some events are tracked by default, while others can be easily added. You can also create custom events.
To determine which events to track, look at your sales funnel and get clear on which actions would determine the effectiveness of each aspect.
For example, you could track form submissions to measure the efficacy of a page that captures leads by getting them to subscribe to your newsletter.
#6: Conversion Rate
Finally, conversion rates.
In GA4, there are two main conversion metrics:
- User conversion rate
- Session conversion rate
As their names suggest, the first measures the percentage of users that converted, regardless of the number of sessions they went through, while the second measures the conversions to sessions ratio.
Generally speaking, the user conversion rate is far more useful and meaningful, considering that the number of sessions each buyer goes through on average before making a purchase varies significantly on the business type, product, and funnel.
That’s the most important metric to determine how compelling and effective your offer and funnel are.
Final thoughts
Many business owners make the mistake of investing in different types of digital marketing to generate leads without ensuring that their sites and apps are optimised to actually convert those leads, therefore wasting their efforts.
Observing the metrics we covered should give you a great starting point to optimise your online presence for more conversions and ensure you get the highest ROI on your digital marketing efforts.